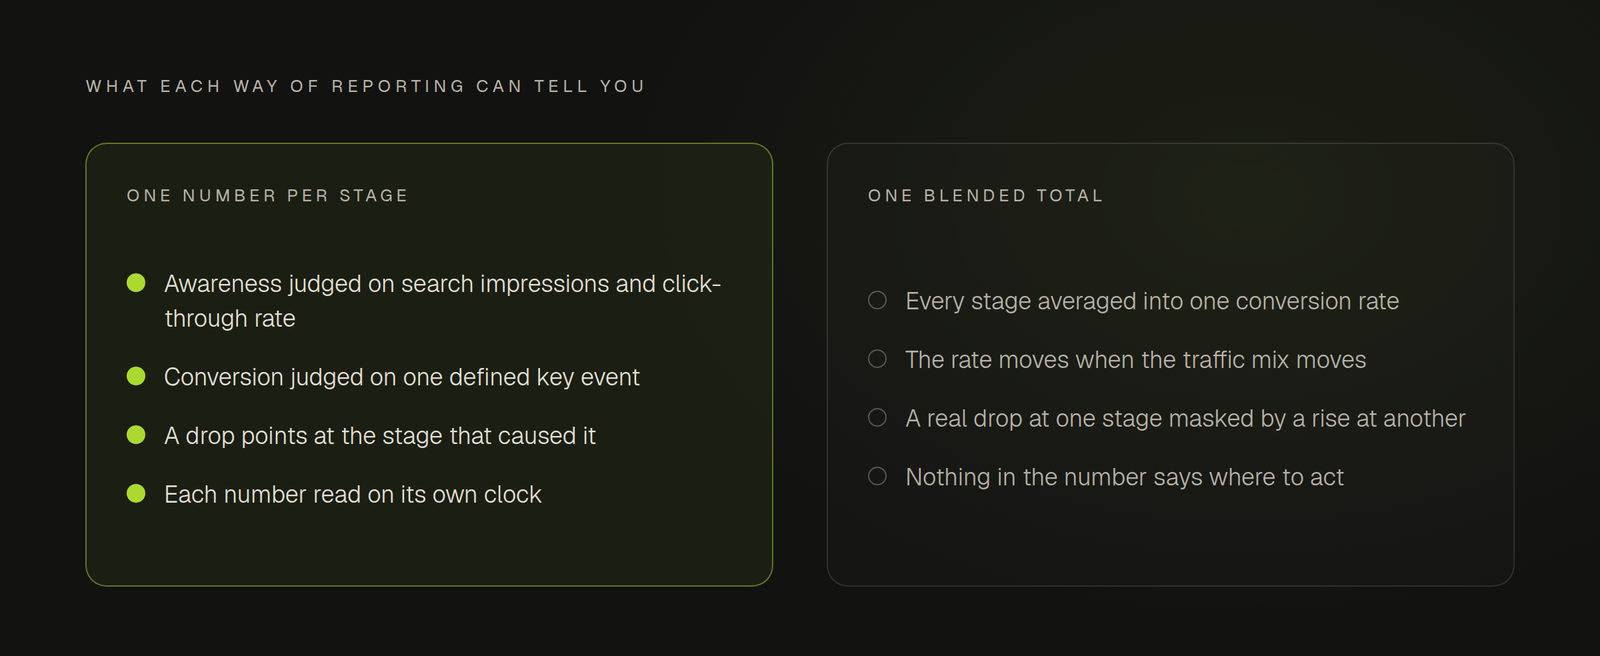
Most marketing KPIs fail for a structural reason rather than a measurement one: they are reported as a single total when the funnel underneath them has four separate jobs. A funnel is a measurement structure before it is a diagram. Choose one number per stage and a bad month tells you where to act. Report one blended figure and it tells you only that something moved.
TL;DR: Pick one KPI per funnel stage, matched to the question that stage can answer and to the speed at which it reports. Awareness carries visibility, consideration depth of engagement, conversion a rate that exists only once someone defines the event, and retention repeat behaviour. A blended total averages four jobs and points at none of them.
What Are Marketing KPIs?
What are marketing KPIs? Marketing KPIs are the metrics a team has committed to acting on: one number per funnel stage, each with a threshold that counts as healthy and a review window. Everything else is a metric, which is anything you can count. A metric with no threshold cannot fail, so it cannot prompt a decision, and a dashboard of thirty of them is a reporting habit rather than a measurement system.
The funnel decides which metric gets promoted. Stage by stage it fixes the question, and the question fixes the number. Measurement belongs in the foundation for the same reason the channels wait their turn in the build order marketing fundamentals follow, not as a reporting layer added later.
Why One Blended Total Hides the Leak
A single conversion rate divides everyone who converted by everyone who arrived, which quietly assumes the arrivals are comparable. They are not. Someone who found you through a branded search and someone who met you through a cold social post sit at different stages, so the blended rate moves whenever the traffic mix moves, with no change in how any stage performed.
That produces two failures at once. A real drop at one stage gets masked by a rise at another, and a rate that drifted because the mix changed looks like a performance problem you then set about fixing. This is why marketing KPIs are chosen per stage instead of summed. The same logic separates demand generation and lead generation: two jobs that cannot answer to one figure.
The Four Stages and the Number Each One Can Move
Four stages, four questions, one defensible KPI each.
| Stage | The question it answers | A KPI that answers it | Review window |
|---|---|---|---|
| Awareness | Are we visible where buyers look? | Search impressions and click-through rate | Quarterly |
| Consideration | Do the people who find us come back? | Returning visitors and email list growth | Monthly |
| Conversion | Does the asked-for action complete? | Completion rate of one defined key event | Weekly |
| Retention | Do customers stay and buy again? | Repeat purchase rate | Quarterly |
Awareness numbers are bounded by what the platform agrees to count, so the definition matters more than the figure. Google's Search Console documentation treats an impression as the moment "a user has seen (or potentially seen) a link to your site in Search, Discover, or News", and counts a click when it "sends the user to a page outside of Google Search, Discover, or News" (Search Console Help). An awareness KPI read from that report measures visibility inside one surface, on that surface's terms. It says nothing about how many people have heard of you, and treating it as though it did is how an awareness target becomes impossible to fail.
The conversion KPI carries a precondition the other three do not: the action has to be declared before anything reports on it. Google Analytics 4 is explicit about the sequence. To measure a key event, its documentation says, you "create or identify an event that measures the action and then mark the event as a key event". Only after that, it continues, "you can view how many users perform the action" (Google Analytics Help). Nothing counts a conversion nobody defined. A team that cannot name its key event does not have a conversion KPI yet, whatever the dashboard shows.
Consideration and retention get less attention because their numbers are indirect. Returning visits, branded search and list growth all measure whether attention survived the first visit, and a customer who buys again did so without being acquired a second time.
How to Set Marketing KPIs That Survive a Quarter
Match the review window to the stage's feedback speed. A conversion rate reports within a week, because a form either completes or it does not. Awareness work reports over quarters, because search visibility accumulates. Read a quarterly number weekly and you get noise. Read a weekly number quarterly and you decide too late.
Write the threshold down before the period starts. It can be directional, and it has to be fixed in advance, because a target agreed after the results are in is not a target.
Then keep one KPI per stage and let the rest stay metrics. Supporting metrics earn their place in diagnosis, once the KPI has moved and you need to know why. Promote all of them and every stage acquires four owners and no decision.
None of this delivers a clean split of credit between the stages. Attribution models disagree, and a visitor who read three posts before converting gets counted differently by each one. The structure is still worth holding, because its job is to tell you which stage to work on next, not to settle how credit is shared. Sempyo is built around that loop, so what gets published is informed by what performed, week after week. It is pre-launch, so there are no customer numbers here and the case above rests on mechanism.
Frequently Asked Questions
What are some examples of marketing KPIs?
Concrete ones, by stage: search impressions and click-through rate for awareness, returning visitors and email list growth for consideration, the completion rate of a defined key event for conversion, and repeat purchase rate for retention. Each becomes an example only once it carries a threshold and a review window. Without those it is a metric sitting on a dashboard.
What are the 5 key performance indicators in marketing?
There is no fixed set of five, which is why the published lists disagree with each other. How many you need is decided by how many stages you are trying to move, so a four-stage funnel wants four. Five is useful only as a starting menu: visibility, engagement, conversion, cost per acquisition and retention. Pick the one per stage your own data can actually report.
What are the 5 marketing metrics?
Asked literally, this question is about metrics rather than indicators, and that distinction is the useful part of the answer. A metric is any number you can count, and there are hundreds of them. Marketing KPIs are the small set you have committed to acting on. The count that matters is not five, it is one per stage.
Conclusion: Marketing KPIs Are a Structure, Not a Scorecard
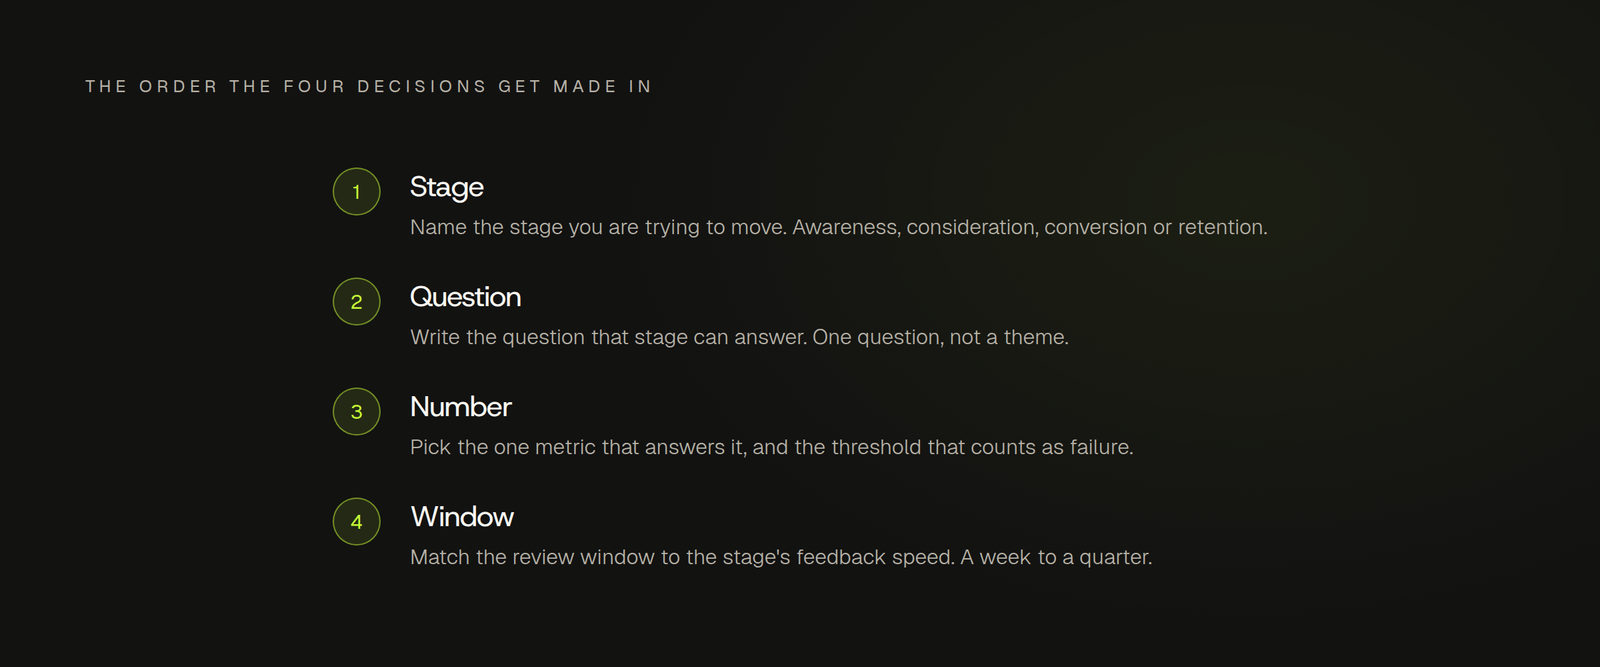
Decide the stage first, then the question, then the number, then the window. A funnel built in that order tells you where to act in the same week you read it.